The impact of WE DO GOOD in figures
Discover WE DO GOOD’s performance through key data on our funded projects and our community of investors. We closely monitor the amounts raised, the number of projects supported, and investor engagement. These figures illustrate not only the platform’s growth, but also our contribution to the social and environmental economy.
Last update: August 2025
Total amount invested
Number of active investors
Projects that currently share their revenue
Our selection of projects
Selected
These are the companies that have successfully raised funds on wedogood.co.
Rejected by our analysts
Once the eligibility test has been completed, the applications are analysed, modelled and presented to an investment committee, which will approve (or reject) the fundraising campaign on wedogood.co.
Automatically declined
We receive applications from companies via an eligibility test that allows us to automate part of the analysis and reject applications that do not meet the minimum requirements.
Statistics on funded projects
By sector
*Ranking of funded projects by sector (energy, technology, health, etc.)
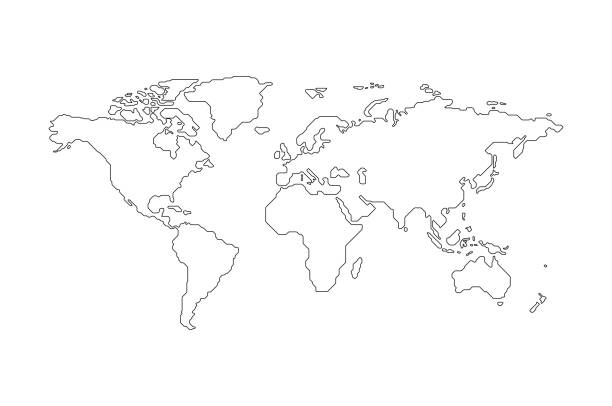
By region & country
France - 96.18% of projects funded
Ranking of funded projects by region (if French)
Région | Total |
Île-de-France | 181 |
Pays de la Loire | 112 |
Occitanie | 66 |
Auvergne-Rhône-Alpes | 64 |
Nouvelle-Aquitaine | 48 |
Provence-Alpes-Côte d'Azur | 37 |
Bretagne | 29 |
Centre-Val de Loire | 25 |
Hauts-de-France | 24 |
Normandie | 14 |
Grand Est | 12 |
Bourgogne-Franche-Comté | 4 |
Réunion | 4 |
Martinique | 1 |
Monde - 3,82% projets financés
Classement des projets financés selon leur pays
Pays | Total |
Espagne | 8 |
Italie | 2 |
Belgique | 5 |
Hong-Kong | 1 |
Portugal | 1 |
Irlande | 2 |
Royaume-Uni | 2 |
Luxembourg | 1 |
Pays-Bas | 1 |


By impact
The various impacts
environmental
Projects that protect the planet, promote energy transition or reduce waste.
social
Initiatives that strengthen social ties, support inclusion and improve everyday life.
economic
Projects that create jobs, support entrepreneurship and revitalise local areas.
Our annual activity reports
Interests
21% by environmental impact
29% by social impact
Legal entities: 815€
Individuals: 4484€
Project leader
Born between 1939 and 2000
Région | Total |
Île-de-France | 193 |
Pays de la Loire | 80 |
Occitanie | 61 |
Auvergne-Rhône-Alpes | 73 |
Nouvelle-Aquitaine | 44 |
Provence-Alpes-Côte d'Azur | 38 |
Bretagne | 23 |
Centre-Val de Loire | 26 |
Hauts-de-France | 25 |
Normandie | 11 |
Grand Est | 15 |
Bourgogne-Franche-Comté | 4 |
Réunion | 3 |
Martinique | 1 |
Guyane | 1 |
Evolution of our Portfolio
29% of projects
are generating more revenue than they had initially anticipated!
achieve between 50% and 100% of their projected turnover
achieve less than 50% of their projected turnover or are more than 6 months behind schedule
had to be subject to debt collection proceedings (on average: 79% of the amount invested recovered)
Our activity reports
Are you conducting a study on the sector? A comparative analysis?
Contact us directly to request accurate, up-to-date indicators that will be comparable with the rest of your study.
You can request a customised analysis to receive specific data and analyses tailored to your needs.